We are committed to sharing unbiased reviews. Some of the links on our site are from our partners who compensate us. Read our editorial guidelines and advertising disclosure.
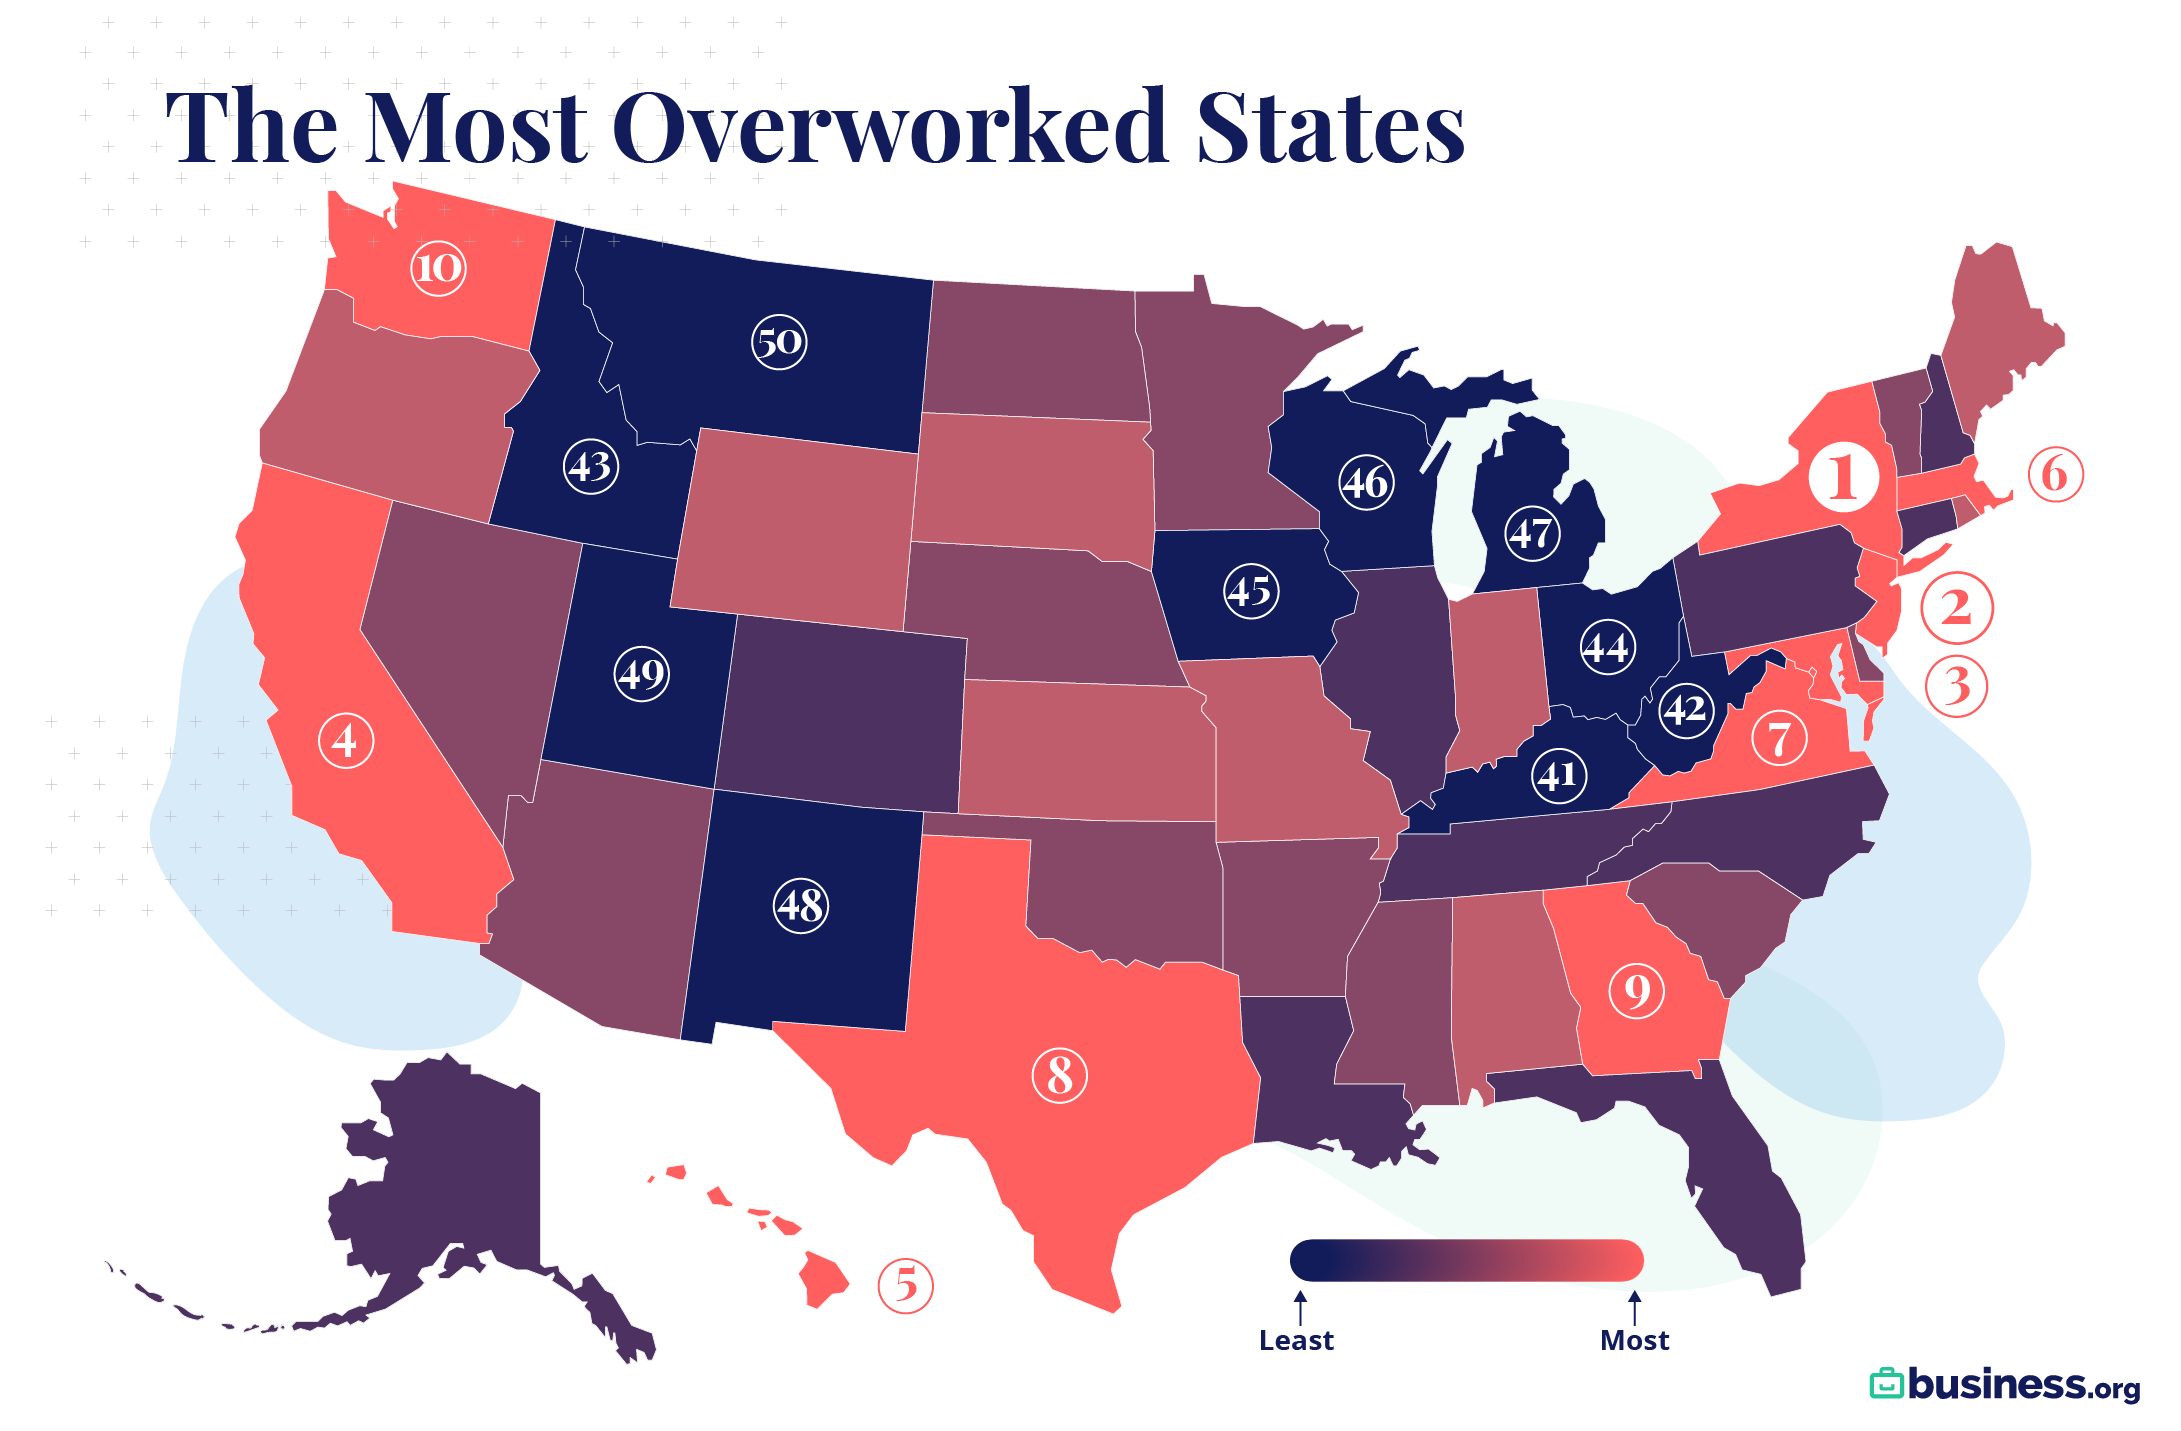
The Most Overworked States in the US, 2020
Which states are the most and least overworked?
Last Updated: several months ago
We updated this piece with the most recent data as of March 16, 2020. We also went more in-depth with our research—factoring in not only hours worked per week but also commute times, the number of full-time workers over retirement age, and the hours that employees in each state need to work at the median wage to afford the rent for a one-bedroom apartment.
As Americans, many of us were raised to believe in a “work hard, play hard” mentality. In fact, workers in the United States work more hours per capita than any other large nation of the same production level.1
But according to some sources, even our extra hours of work each week may no longer be enough. In a recent study, the Manhattan Institute suggested it takes 53 weeks for a male American worker (making the national median wage) to earn enough to cover major household expenditures like housing, transportation, health insurance, and education costs.2
That’s a major problem considering there are only 52 weeks in a year. And considering the ongoing gender pay gap in the US, the situation is likely even more dire for working women.
Long story short: we all need to make ends meet, but no one wants to have to work 60-hour weeks, endure long commutes, or delay retirement to do it. To that end, we did some research to find out which states in the US are the most and least overworked. Here are the results we found.
Interesting findings
- New York is the most overworked state. Not only is New York expensive to live in, but the state also has a significant commuter culture. In fact, New Yorkers spend an average of 34 minutes commuting to work—or more than 5.5 hours per week. That’s the longest average commute time in the US.
- Montana is the most laid-back. People in Montana work an average of just 38.1 hours per week, commute an average of only 18.6 minutes per day, and enjoy some of the most affordable housing in the nation.
- Only three states feature an average workweek longer than 40 hours. Wyoming, North Dakota, and Alaska see average workweeks at 40.3, 40.4, and 41.7 hours, respectively. Surprisingly, though, none of these states wound up in our top “Most Overworked” states—mostly due to their cheap real estate and short average commute times.
- Hawaii’s not so relaxing if you live there. Despite being a top vacation spot for overworked employees looking to relieve stress, Hawaii is the fifth most overworked state in the nation for anyone actually living and working in the Aloha State.
- Avoid Alaska if you want to retire early. Not only does Alaska feature the highest average number of hours per workweek—the state also has the highest rate of full-time workers over the age of 65.
- The most overworked states tend to be the most expensive to live in. In a surprise to no one, people in areas with expensive real estate have to work more hours to afford their housing.
Our methodology
To determine our rankings, we pulled data from the US Census Bureau’s most recent American Community Survey (ACS), the University of Minnesota’s integrated public use microdata series for US census microdata, the Bureau of Labor Statistics, and even Zillow.
Using this data, we were able to calculate the following statistics, which we then weighted as follows:
- Average usual hours worked, ages 16–643 (30%)
- Number of hours worked at median wage to afford median rent on a one-bedroom property4,5 (30%)
- Percent of workers over 64 years old working more than 34 hours per week6,7 (15%)
- Average commute time for workers 16 and older who don’t work from home 8 (25%)
This gave us a score for each state—the lower the score, the more overworked the workers in the state.

Expert Advice, Straight to Your Inbox
Gain confidence in your business future with our weekly simple solutions newsletter.
By signing up I agree to the Terms of Use and Privacy Policy.
The results
The takeaway
To sum up, Americans are still working hard, but they may no longer have the time and financial means to play hard too.
That lack of work-life balance poses a serious threat to the health and happiness of US workers. In fact, in a recent survey by Mental Health America, an incredible 63% of respondents said the frustration or stress of their job had caused them to engage in unhealthy behaviors, such as drinking or crying regularly.9
So if you’re looking for a job with better work-life balance, you’re definitely not alone. But while you’re job hunting, you should keep in mind that some states are better to work in than others. According to our research, Montana is the best place to live if you want a more laid-back work environment, while New York is the state to avoid due to its high rent prices, long commute times, and low percentage of adults retiring on time.
Looking to start a business? Believe it or not, the best states for entrepreneurs aren’t always the least overworked states. Check out our guide to the best states for launching a business to see where you have the best chance of success.
Related content
Sources
- Our World in Data, “Annual Average Working Hours vs. GDP per Capita, 2017”
- Manhattan Institute, “The Cost-of-Thriving Index: Reevaluating the Prosperity of the American Family"
- United States Census Bureau, “American Community Survey (ACS) 2018”
- US Bureau of Labor Statistics, “Occupational Employment Statistics”
- Zillow, “Housing Data”
- United States Census Bureau, “American Community Survey (ACS) 2018”
- IPUMS USA, University of Minnesota, “US Census Data for Social, Economic, and Health Research”
- United States Census Bureau, “American Community Survey (ACS) 2018”
- Mental Health America, “Mind the Workplace: MHA Workplace Health Study 2017”
Recent Articles

6 Ways to Find Affordable Health Insurance If You’re Self-Employed
From the Health Insurance Marketplace to insurance brokers, try these six resources to find affordable...

7 Best Workers Compensation Insurance Companies for Small Businesses 2026
Safeguard your business with our top seven picks for best workers compensation insurance companies. Best...

10 Best General Liability Insurance Companies for Small Businesses 2026
Protect your business from costly lawsuits and claims. Check out Business.org’s picks for the best...

How Much Revenue Do You Need Before Hiring an Employee?
It’s expensive to hire an employee. Learn how much to budget for a new team...
