We are committed to sharing unbiased reviews. Some of the links on our site are from our partners who compensate us. Read our editorial guidelines and advertising disclosure.
The State of Small Business in 2022: Has the Pandemic Stopped Entrepreneurs?
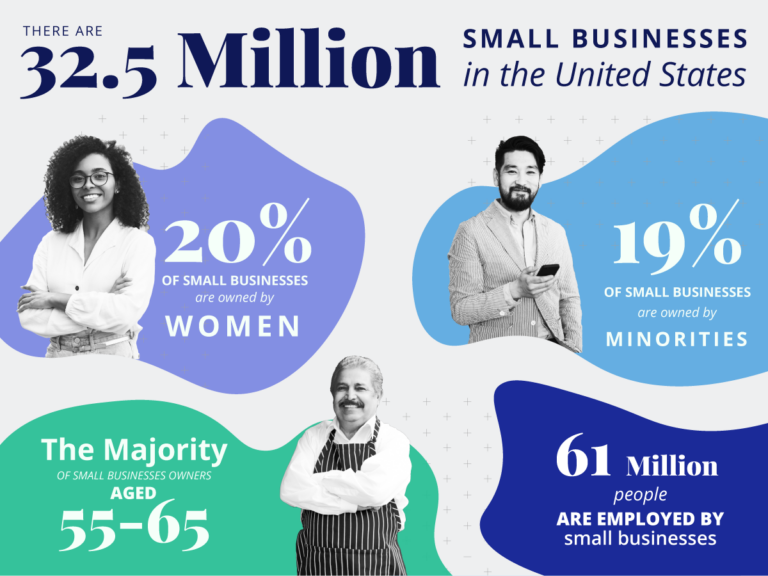
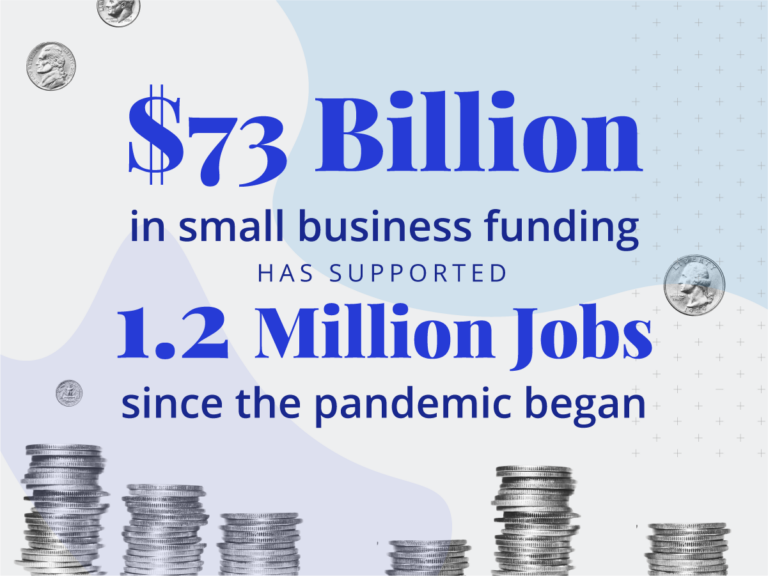
Between 2020 and 2021, over $73 billion was spent on funding small businesses, and that funding supported over 1.2 million jobs.1,2 Despite the pandemic, there’s still a lot of hope (and money) for small-business owners. Using data from the US Census Bureau, we’ll take a look at what’s happening in the small business sector:
Most small-business owners are older white men. However, most folks looking to start a business can do so with the right resources, tools, and information. To encourage and empower more people to create their own businesses, we’ve provided guides for small-business loans for women, as well as small-business loans for minorities.
- Women now make up to 20.4% of small business owners.3
- Roughly 1.1 million businesses (or 18.7% of small businesses) are minority-owned.
- The highest percentage of owners fall in the 55-to-64 age range.

Get Access to Our Research Reports
Provide your email to receive our reports on small-business and industry trends.
By signing up I agree to the Terms of Use and Privacy Policy.
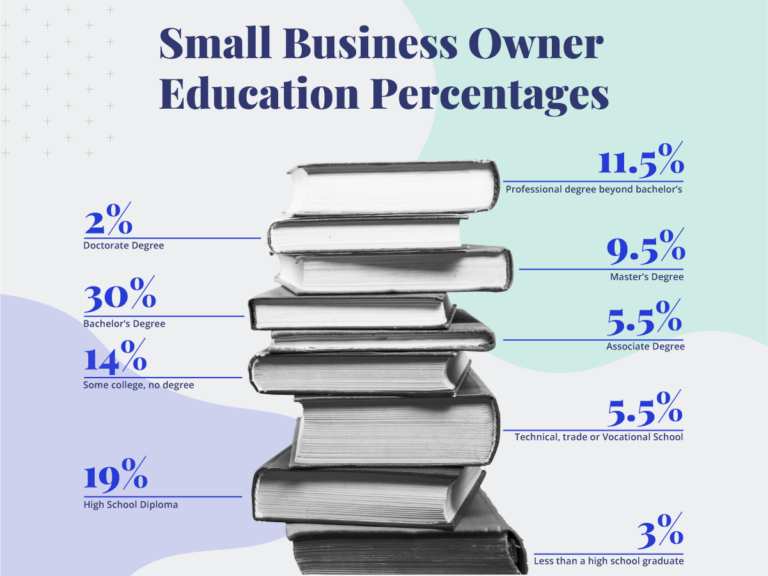
Small-business ownership by degree of education
- Bachelor degree: 30.1%
- High school diploma: 18.8%
- Some college, no degree: 14.1%
- Professional degree beyond bachelor's: 11.4%
- Technical, trade, or vocational school: 4.7%
- Associate’s degree: 5.6%
- Less than high school graduate: 2.8%
- Doctorate: 2%
Most small-business owners have a high school diploma at least. Those who have not received a high school diploma and those who have a doctorate are less likely to be small-business owners.
How many small businesses closed during the pandemic?
The pandemic caused many small businesses to shut down shop, at least temporarily. Unfortunately, many of those closures were permanent.
From October 2020 to October 2021, one in five businesses shut down:4,5
- 1,314,026 small businesses temporarily closed a location (21.7%).
- 423,879 small businesses reopened after closing down (7%).
- 1,017,311 small businesses permanently closed (16.8%).
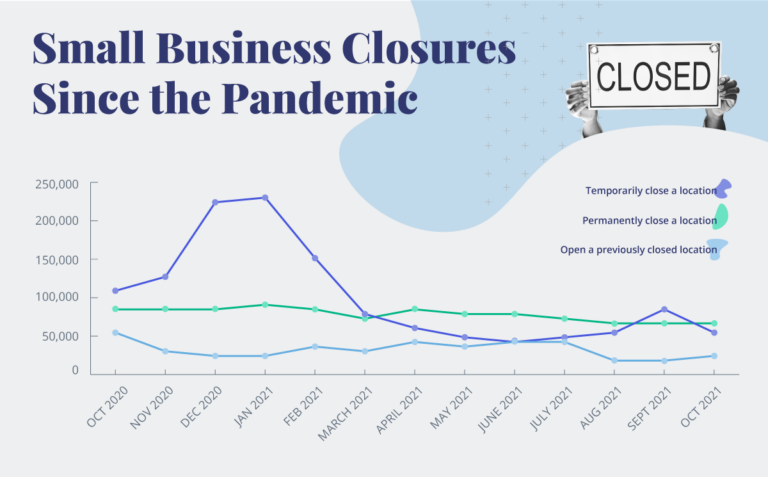
The closure of a small business impacts the owners and the jobs they’ve created along the way. As we previously mentioned, nearly half of US jobs are created by small businesses.
Have small business applications increased or decreased?
From 2019 to 2020, business applications in the US saw a positive 24.2% increase, meaning even more folks were working toward small business ownership.6
If you’re ready to start a small business, we have a variety of articles and tools dedicated to startups that will help you with loans, finances, and more.

How many small business loans have been funded during the pandemic?
During the past couple of years, Small Business Administration loans (or SBA loans) have helped many small businesses get the money they needed—over $73 billion in approved loans between 2020 and 2021.
More approved dollars and a higher guarantee backing from the SBA means more small-business owners have access to lower interest rates, higher loan amounts, and refinancing options.
7(A) loans
From 2019 to 2021, we saw a 62.03% increase in approved dollars for 7(A) loans and an increase of 84.31% in the approved SBA guarantee amount. The dollars approved rose to over $36.5 billion, and the SBA guaranteed $30.5 billion of those funds.
The number of approved 7(A) loans dipped -18.51% in 2020, but we saw that difference overcome with a 22.60% positive growth in 2021.
504 loans
For 504 loans, we saw an increase from 2019 to 2021 of 41.04% for approved dollars and approved SBA guarantee amount. In 2020, 504 loans increased despite the pandemic, unlike the 7(A) loans.
With a total of 130,881,471 employees in the US, small businesses employ almost half of those employees (46.80%). In fact, the US has over 6 million small businesses with over 61 million employees. Small businesses have an average of 10 employees each.
Between 2020 and 2021, small business loans totaled more than $73.5 billion, and that funding supported 1,222,759 jobs. On average, it takes $60,154 of funding to support one job.
- Across the US, accommodation and food services had the highest approval total of $11,931,616,120.
- Telecommunications had the highest average required funding to support each job at $157,250, while the rentals category had the lowest needed amount at $2,857.
- Professional, scientific, and technical services had the most firms supported by SBA loans (821,129 firms).
- Construction is the industry with the highest percentage supported by SBA loans (99.84%).
Which industries have the most small businesses?
SBA loan money is spread across different industries and varies by state. Some small businesses make up the overwhelming majority of the industry in a state.
For example, in 31 states, small businesses make up 100% of the entire animal protection services industry.7
However, we can see a wide range across the country. On average, small businesses make up 96.60% of the US utilities industry, but only make up 20% of the total utilities industry in Washington, D.C.
Small business industry breakdown
With the disruption of the pandemic, it may seem like a strange time to build a small business, but we’re seeing a variety of ways for people to break into their own businesses with the government funding to back them up.
With dedicated effort and education, small-business loans, and a little luck, you may be able to get your business thriving in 2022—and we’re here to help.
If you’re looking to start or grow your own business, check out our resources below:
Methodology
We used the Census Bureau’s 2018 Statistics of U.S. Businesses to calculate the number of small businesses for each state and the country. We narrowed the range of businesses to ones with less than 500 employees and excluded businesses without any employees.
We also pulled data from the 2019 Annual Business Survey: Owner Characteristics of Respondent Employer Firms to calculate the number of female and minority-owned businesses and the largest age group of business owners and their highest level of education.
To calculate the total number of small businesses impacted by the COVID-19 pandemic, we used data from the Census Bureau’s Small Business Pulse survey compiled by Statista as November 30, 2021.
We also used the Census Bureau’s Business Formation Statistics to calculate the number of business applications submitted in each state from 2019 to 2020.
We pulled lender activity reports from the Small Business Association to calculate the percent change in 7(A) and 504 reports from 2019-2021. We used 7(A) and 504 approval data to find the money approved for loans in 2020 and 2021. We also calculated the amount of money approved and the number of jobs supported by those loans for specific industries.
The Census classifies each small business into a single industry using the North American Industry Classification System sectors and subsectors. We used the NAICS sector classification to calculate the total number of small businesses in each industry and what percentage of the industry is made up of small businesses as of the Census’ 2018 release.
Sources
- US Census Bureau, “2018 Statistics of U.S. Businesses.” Accessed January 8, 2022.
- SBA, “Loan Activity by Month and Year From the Current Fiscal Year to 1991.” Accessed January 8, 2022.
- US Census Bureau, “2019 Annual Business Survey: Owner Characteristics of Respondent Employer Firms.” Accessed January 8, 2022.
- Statista, “Share of Small Business Closings Due to COVID-19 US 2021.” November 30, 2021. Accessed January 8, 2022.
- US Census Bureau, “Small Business Pulse survey.” Accessed January 8, 2022.
- US Census Bureau, “Business Formation Statistics.” Accessed January 8, 2022.
- US Census Bureau, “ 2018 SUSB Annual Data Tables by Establishment Industry,” Accessed January 8, 2022.
