We are committed to sharing unbiased reviews. Some of the links on our site are from our partners who compensate us. Read our editorial guidelines and advertising disclosure.
The Paycheck Protection Program Is Saving Jobs Across America
Interesting findings
Now that $519 billion in PPP loans has had time to work, one question still hangs in the air: Has the funding been effective? According to recent data released by the U.S. Treasury Department,1,2 the answer is yes.
Thousands, hundreds of thousands, and even millions of jobs have been saved in each state. With unemployment reaching significant highs in April of this year, we can only imagine how much worse things could have been if the PPP loans didn’t help retain American jobs during this economic crisis.
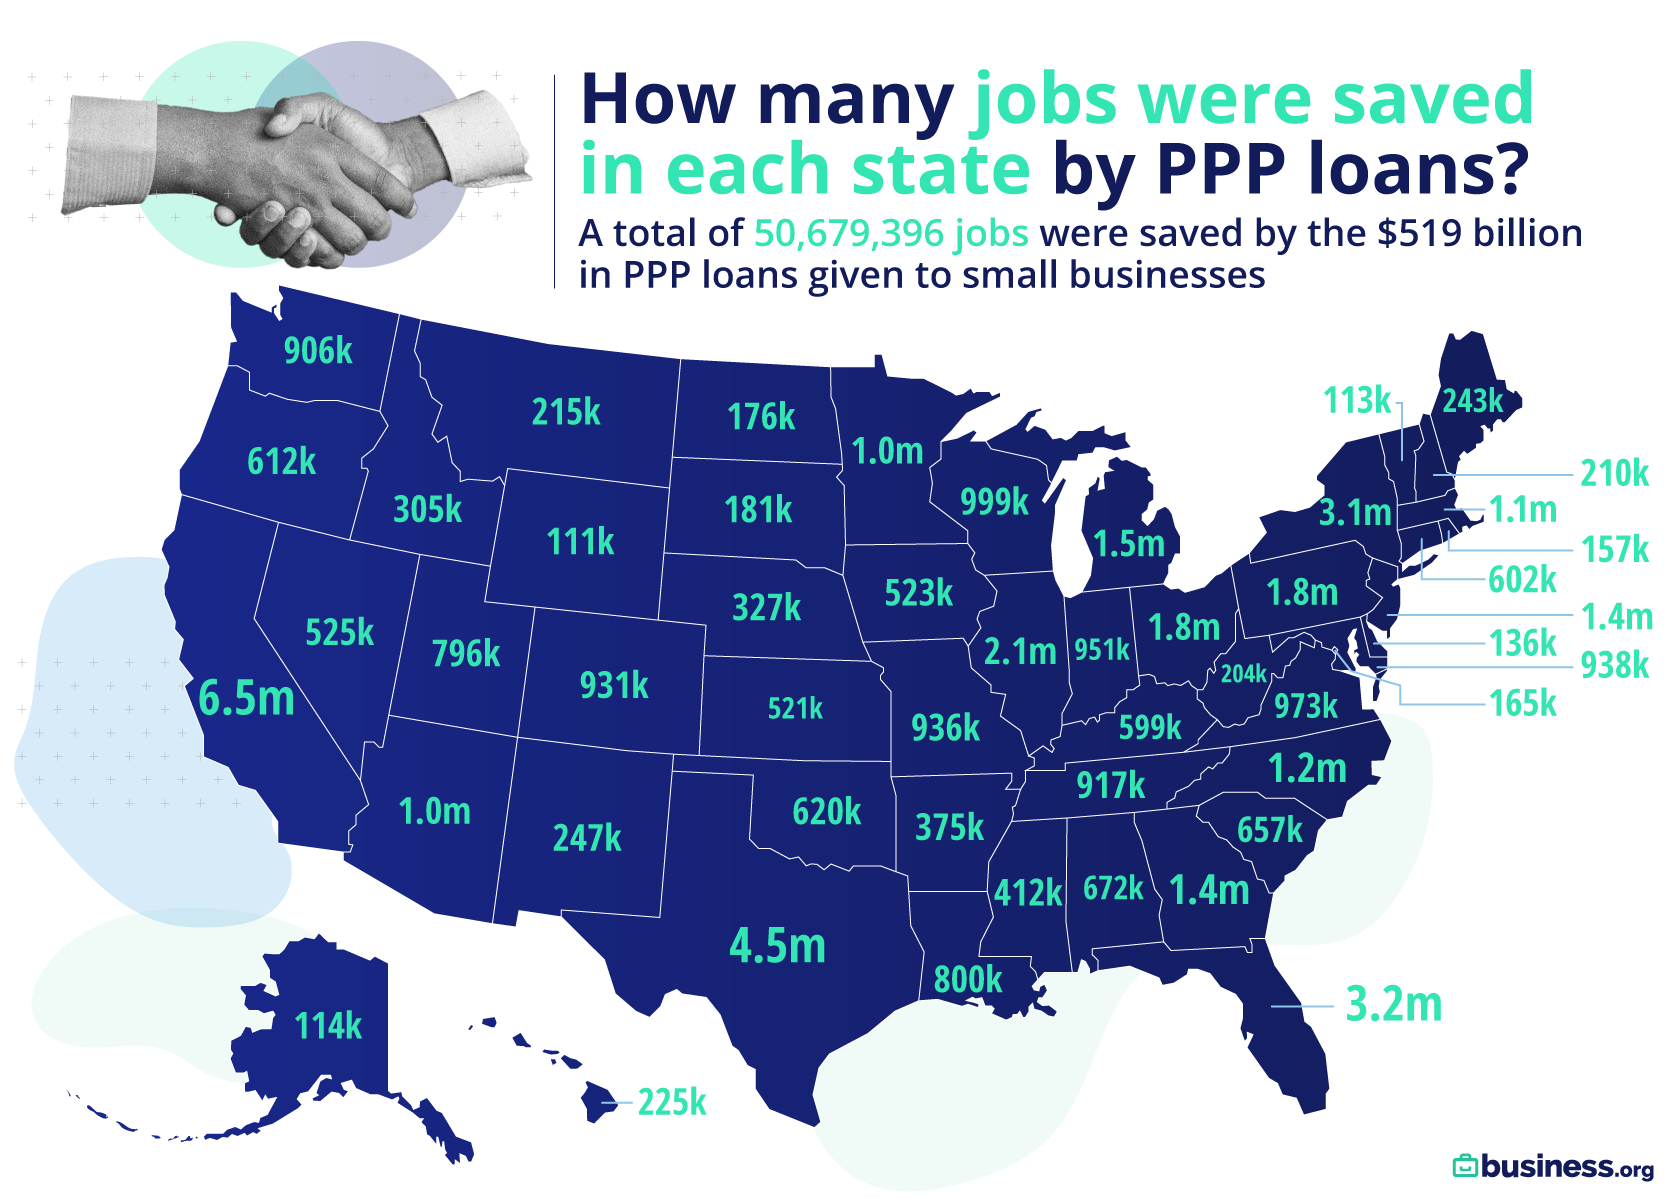
As for each state, there’s a direct correlation between the number of jobs saved and the amount of funding received. Let’s take a look at how the numbers break down on a per-state basis.
We found a number of compelling details in the Treasury Department’s data that give a very positive outlook on the success of PPP loans:
- Over 50 million American jobs (50,679,396, to be exact) have been preserved as a result of the over $519 billion in PPP loans given to small businesses.
- Over 19 million jobs were saved as a result of loans below $150,000, while 31 million jobs were retained from loans of $150,000 and above.
- California had the most PPP loan approvals of all the states, resulting in over 6.5 million saved jobs.
- The more loan funding a state received, the more jobs were saved, demonstrating that the program effectively preserved American jobs during a time of high unemployment.
These findings prove the PPP loans’ success. The 19 million jobs that were saved by loans below the $150,000 mark show that investment in small business is crucial to the health of the jobs market—especially considering that small businesses constitute 47.3% of all United States employees.3
Another sign of the PPP’s success? The simple fact that staggering numbers of jobs are being saved in each state. And the states with the fewest saved jobs tended to be less populous and received less funding, showing that there’s a direct correlation between the amount of PPP funding and the preservation of American jobs.
Does this mean we need more funding? It’s hard to tell at this point. Unemployment is dropping month by month,4 which is a sign of both businesses reopening and PPP funding going into effect across the country. If the decrease in unemployment ever plateaus, we may need to consider offering more PPP loans.
Methodology
We scoured through SBA’s Paycheck Protection Program loan-level data to find how many jobs were retained because of PPP loans. We then broke down data to see how each state was affected by the PPP loans granted to their small businesses.
Applying for a small-business loan soon?
Our free checklist can help you understand what lenders are looking for.
By signing up I agree to the Terms of Use.
The takeaway
The Paycheck Protection Program has played a key role in helping businesses and their employees weather the economic crisis brought on by the global pandemic. With so many jobs saved already and unemployment rates decreasing every month, things are looking up for American workers.
Now, all we have left to do is keep our finger on the pulse of the unemployment rate to make sure it keeps decreasing. If unemployment stops decreasing or begins to rise again, we may have to consider further action to bolster the jobs market.
Sources:
1. U.S. Treasury Department, “PPP Loan Amount by State.” Accessed July 16, 2020.
2. U.S. Treasury Department, “Jobs Retained by State.” Accessed July 16, 2020.
3. U.S. Small Business Administration, “2019 Small Business Profile.” Accessed July 16, 2020.
4. Trading Economics, “United States Unemployment Rate.” Accessed July 16, 2020.
Recent Articles

EarthLink Business Internet Review 2026
Flexible, reliable business internet for small and growing teams. Flexible internet for small businesses Earthlink...

Fiber vs. Cable Business Internet for SMBs
How to choose a reliable internet connection with the uptime your small business needs For...

T-Mobile Business Internet Review 2026
Offers simple 5G business internet designed for small and growing businesses that want fast setup,...

Starlink Business internet review
Low-latency satellite internet for companies operating beyond the reach of traditional broadband. Best for Rural...
