We are committed to sharing unbiased reviews. Some of the links on our site are from our partners who compensate us. Read our editorial guidelines and advertising disclosure.
What Is ABC Inventory?
With ABC analysis, you can maintain maximum control over inventory levels for your highest-value items. Here’s how it works.
If you’re selling hundreds or thousands of products, trying to manage each item can quickly become overwhelming. Fortunately, ABC analysis provides an answer.
ABC inventory classification helps you sort items in your inventory according to their annual consumption value (a.k.a. the amount of profit you make per item sold). This allows you to prioritize inventory management tasks based on their value to your company, since items in category A have a more significant effect on your bottom line compared to items in category B or category C.
Interested? Read on to get more details about ABC analysis and how to implement it in your inventory model.
ABC inventory classification vs. ABC Inventory software
In this article, we’re focusing on the ABC method of inventory classification. For more information on ABC Inventory (the inventory management software), check out our review.
What is the ABC approach to inventory control?
ABC inventory analysis involves grouping your products into three categories based on their usage value—the total number of units sold (or used) in a given period, multiplied by the cost per unit.
While the details vary from business to business, ABC inventory categories usually follow the same pattern:
- A items: Your company’s most important products. This category usually includes items with high sale volumes, high costs, or both.
- B items: Less important items. These products may not sell as quickly as A-level items, or they may be cheap to produce.
- C items: The least important items in your inventory. This category is the largest of the three, but it makes up the smallest portion of your business’s total inventory value.
Once items are assigned to a category, inventory managers can prioritize their tasks (like reordering, cycle counting, and supply chain supervision) based on the importance of the item. This ensures that the most important, A-level items in your inventory remain tightly controlled, which minimizes loss.
Pros and cons of ABC inventory analysis
Strengths
Weaknesses
When you use ABC analysis, you can easily prioritize management tasks for the items that have the biggest impact on your business. This ensures that your class A items get the most attention, so you’re less likely to run out of safety stock on your highest-value products.
ABC classification also helps make your stock management process more efficient, since your inventory planner knows exactly which items to focus on to minimize your costs and maximize your profit.
ABC inventory can be somewhat limited, however. For starters, classifying items by their usage value means new items (with no sales data to draw from) have zero usage value.
It also doesn’t account for items that would normally be class B or class C items but need to be temporarily treated as class A items. So let’s say a manufacturing issue forces you to immediately reorder all your stock on a C-level item. You may need to temporarily treat that item as an A-level item, but your system would de-prioritize tasks for that item because it’s technically a C-level product.
Now, you can create a list of products that are exceptions to your ABC classification. But that means every time you reclassify your items (which we recommend doing regularly), you need to compare your classification to your list of exceptions and adjust. This can get inflated and overcomplicated very quickly, especially if multiple people within your organization have a say over how products get prioritized.

Expert Advice, Straight to Your Inbox
Gain confidence in your business future with our weekly simple solutions newsletter.
By signing up I agree to the Terms of Use and Privacy Policy.
How to apply ABC inventory classification
Analyze your current system
The first thing you need to do if you want to implement ABC analysis is analyze your current system to make sure it can handle operating with the ABC approach. If your system doesn’t currently allow you to prioritize some items over others, you may have to revamp your entire inventory management system—which can be expensive, time-consuming, and altogether frustrating.
To start using the ABC code, you’ll also need to ensure that you have accurate records on inventory cost and customer demand. Both cost and demand are important elements to determining each item’s usage value—without these details you won’t know which items to sort into category A and which to sort into category C.
Calculate values
It’s time to start figuring out how each of your products contribute to your business. Here’s how:
1. Determine the time period for your analysis. While many businesses opt to use annual consumption value (which analyzes the amount and cost of products sold within the past year), you could choose to look at sales for just the past month or quarter—the choice is yours.
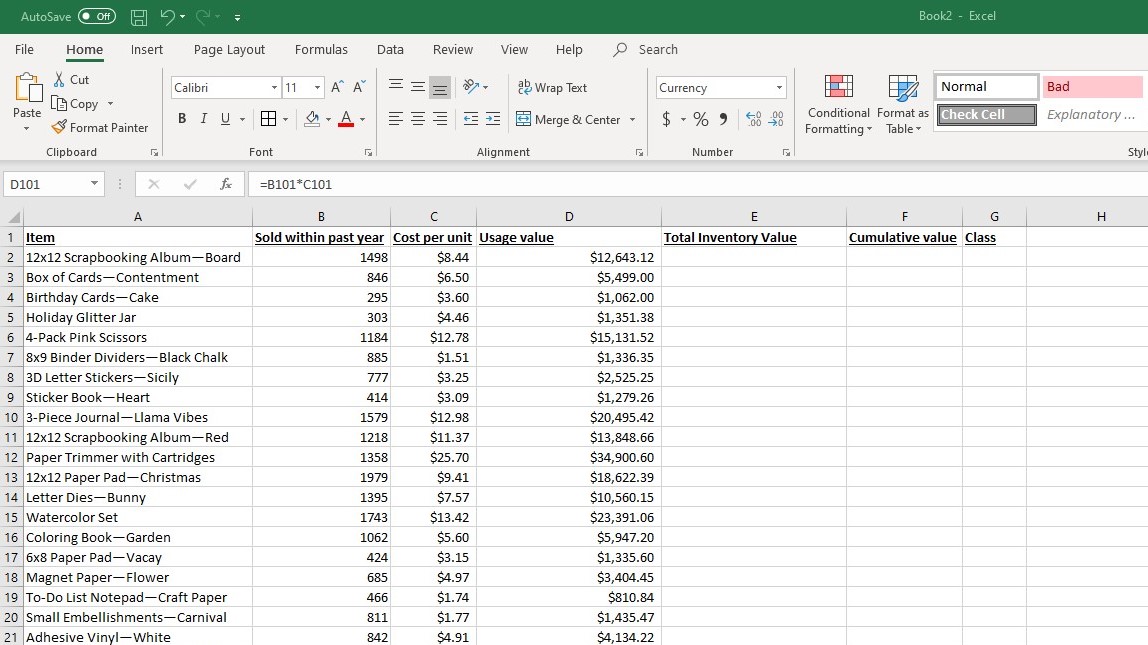
2. Find the usage value of each item by multiplying the number of units sold by the total cost per item.
Usage value = units sold x cost per item
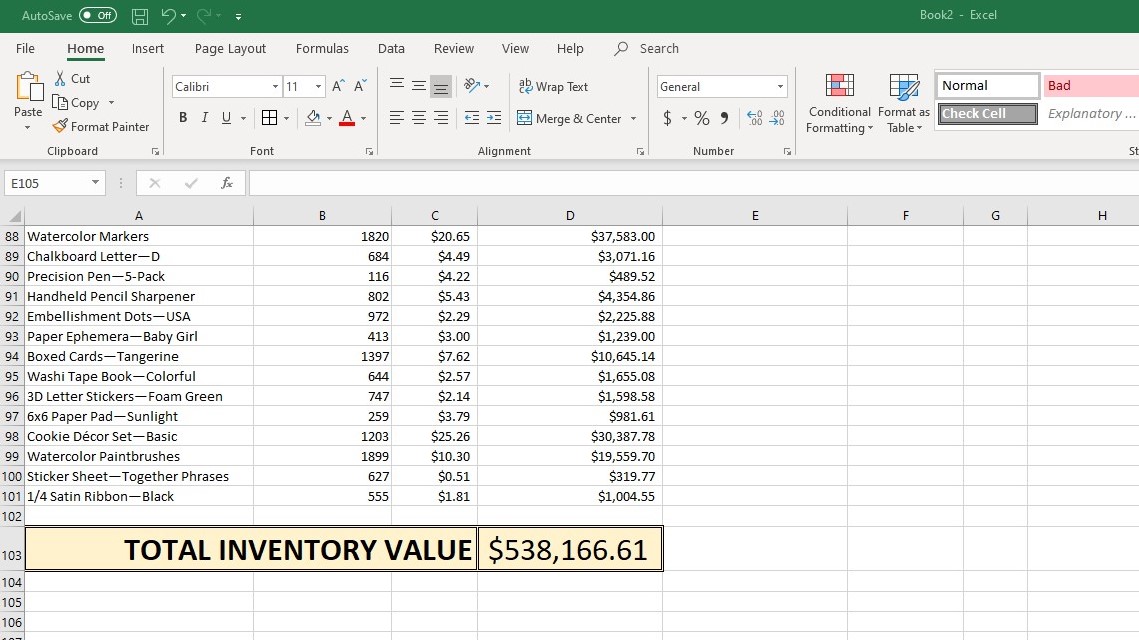
3. Calculate your total inventory value* by adding all the individual usage values for your products.
Total inventory value = product 1 usage value + product 2 usage value + etc.
4. Sort products (within your Excel spreadsheet or whatever tool you’re using) from highest usage value to lowest.
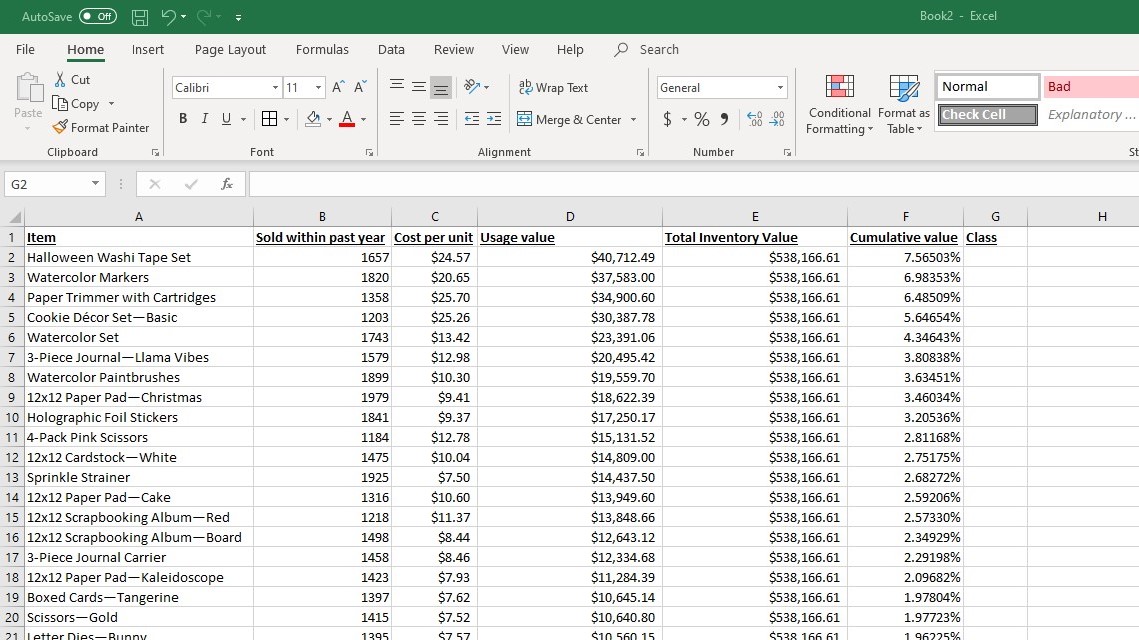
5. Calculate each item’s cumulative value by dividing the product’s inventory value by the total inventory value, then multiplying by 100. This should give you the percentage of your total inventory value that can be attributed to each item.
Cumulative value = (product inventory value / total inventory value) x 100
Keep in mind that while most inventory planners can calculate these values manually, any inventory management software that supports ABC analysis should be able to calculate these values for you automatically.
*Vocab FYI
The terms total inventory value, total consumption value, and total usage value are used interchangeably when it comes to ABC analysis. They all refer to the sum of the usage values (the number of items sold, multiplied by the cost per item) for all the products in your inventory.
Define the parameters
ABC analysis is loosely based on the Pareto principle, which basically says that the majority of any effect comes from a very small portion of the causes. Applied to ABC analysis, this means the bulk of your inventory’s total consumption value gets allocated to A items, while B and C items make up less of that value.
You can decide the precise percentage of inventory items and consumption value allocated to each category. But generally, your values should fall into the following ranges:
- A items: 10%–20% of your inventory, accounting for 60%–80% of your annual consumption value
- B items: 20%–30% of your inventory, accounting for 20%–30% of your annual consumption value
- C items: 50%–70% of your inventory, accounting for 5%–15% of your annual consumption value
Sort inventory items
Once you know how much each product in your catalog contributes to your business’s total usage value, you can sort your stock items into categories, based on the parameters you set ahead of time.
So if you decided to look at sales volume over the past year, you’d sort the items with the highest percentage of your total annual usage value into category A. You’d keep adding items to category A until you hit the value parameter for that category (60%–80% of your total annual usage value). Then you’d continue by adding items to category B until you hit 20%–30% of your total annual usage value. All remaining items would fall into category C.
Measure and reevaluate
Congratulations—you’ve officially implemented ABC analysis within your inventory management system. Unfortunately, it doesn’t stop there.
Over time, your products are bound to change. A supply chain vendor may suddenly decide to charge more to ship your goods. Your manufacturer may drop the unit cost for certain items. Demand may pick up or slow down.
As these changes occur, your products’ share of your total inventory value will change, which means you’ll need to adjust your ABC classification to match those changes. The last thing you want is to treat what is now an A-level item as a C item based on an outdated classification. So make sure you reevaluate your ABC code regularly.
Best Inventory Management Software


Example of ABC inventory management in action
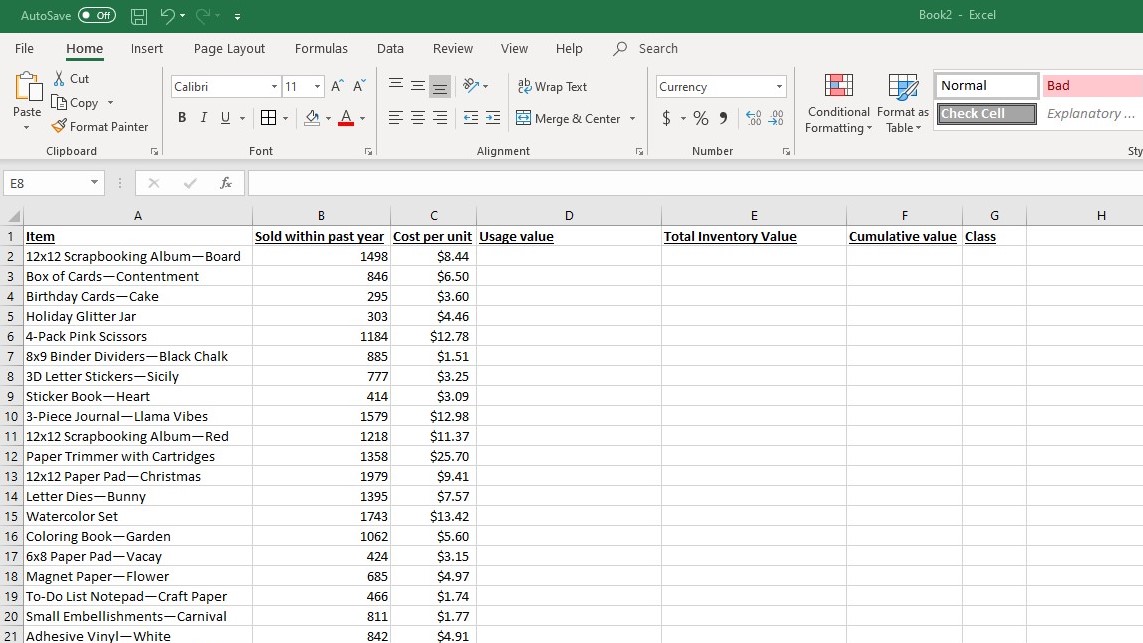
Let’s say you run a craft supply business that sells 100 items. You’d start by making a list of your products and noting the number of units sold per item within the time period you choose. You’d also want to write down the cost per unit for each product on your list (including production costs, supply chain costs, and storage costs).
Now you’d want to calculate the usage value for each item, which you’d do by multiplying the number of units sold by the cost per unit.
From there, you can add the usage values for all your items to get your total inventory value.
Next, you’d sort your items by their usage value (highest to lowest) and calculate the cumulative value for each item. That should give you an idea of the percentage of your total inventory value each item accounts for.
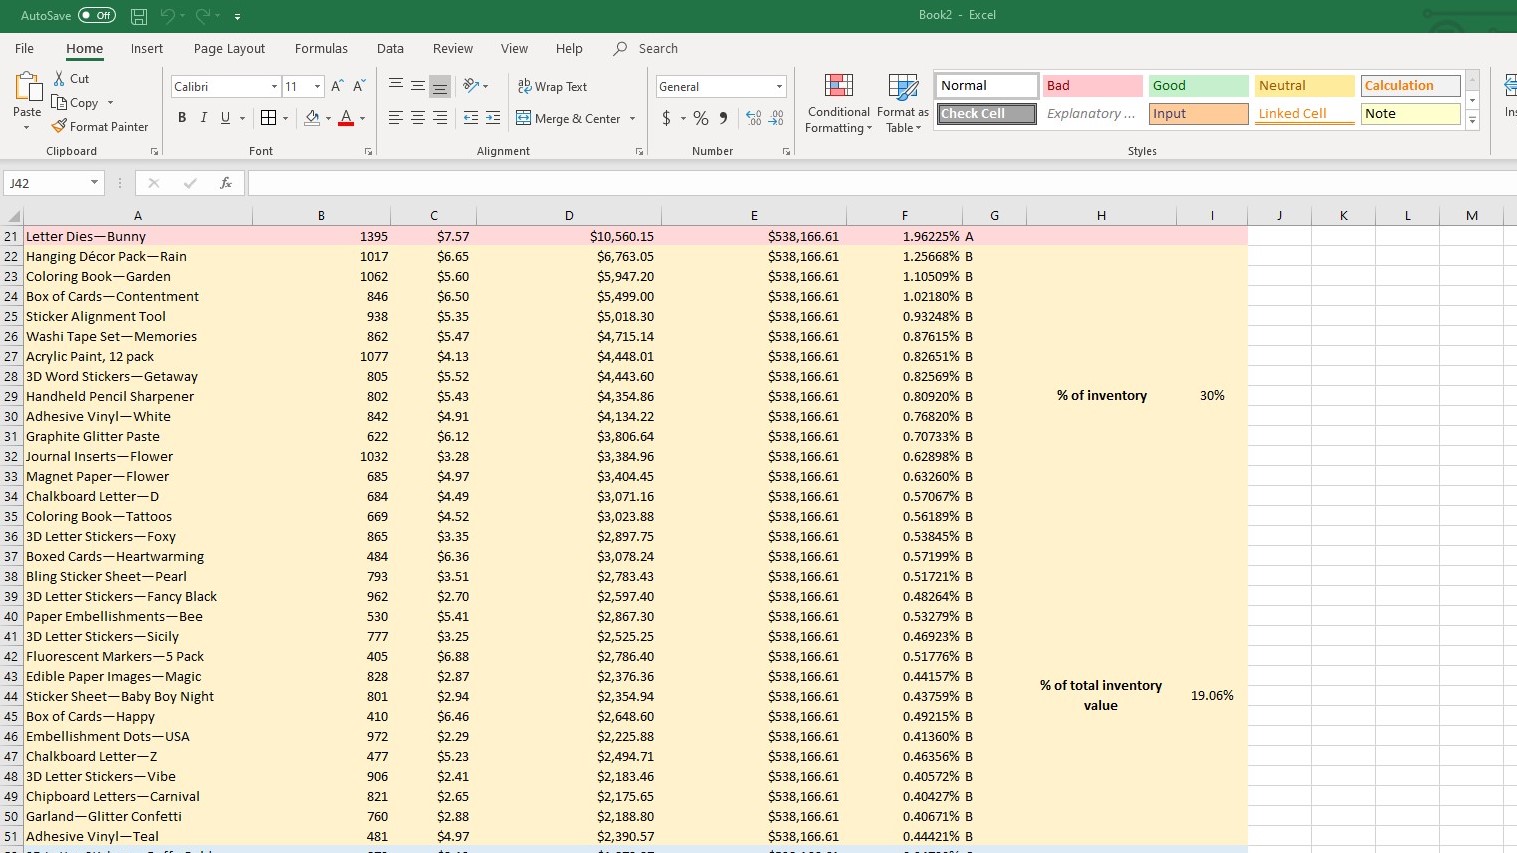
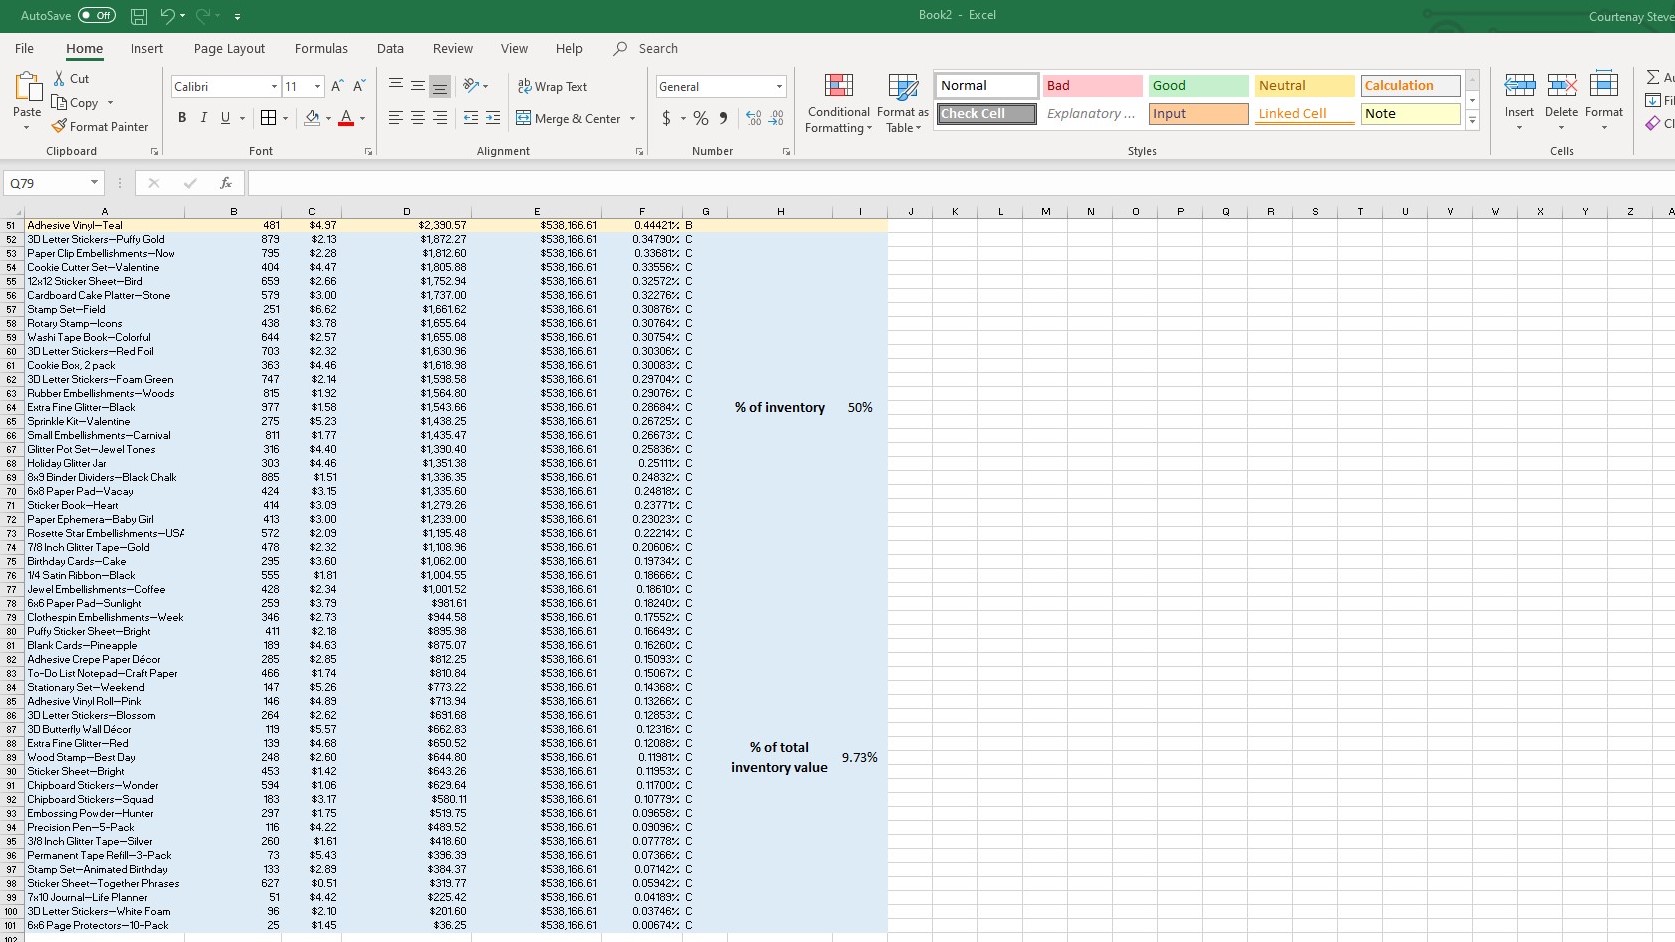
Finally, you’d sort your products into class. Based on the data, you’d probably decide to use the following loose parameters for your ABC inventory analysis:
- A items: 20% of inventory, accounting for 70% of annual consumption value
- B items: 30% of inventory, accounting for 20% of annual consumption value
- C items: 50% of inventory, accounting for 10% of annual consumption value
As you can see, our category A items did equal 20% of our inventory, but accounted for 71.2% of our total inventory value—a bit above the 70% parameter.
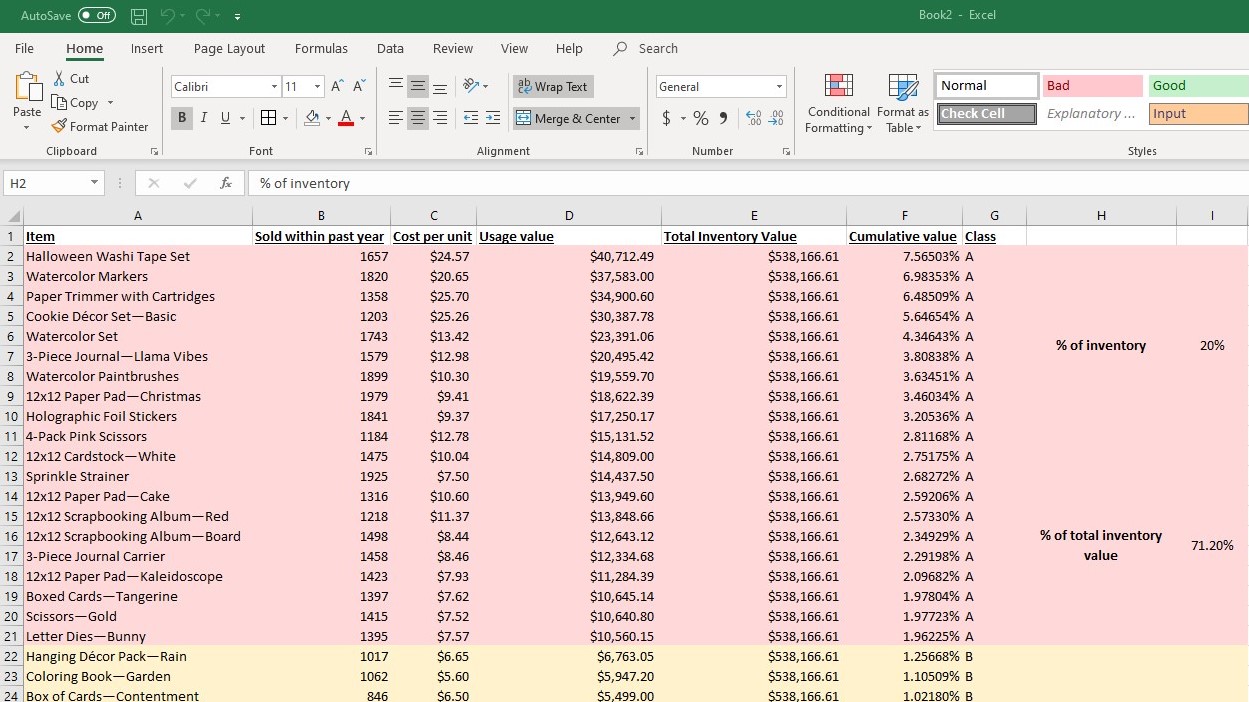
Likewise, our category B items were a bit under the 20% parameter set for the category—but it was 30% of our total items.
And our category C items were 50% of our inventory catalog, but came in just below the 10% total inventory value parameter we set.
Once we sort our items into categories, we can use this system to prioritize tasks.
So let’s say you come in at the start of the day with five inventory tasks to complete:
- Request a quote on Handheld Pencil Sharpeners
- Follow up with third-party logistics provider on transport of Holiday Glitter Jars
- Reorder Watercolor Markers
- Verify incoming shipment of Adhesive Crepe Paper Décor
- Check stock levels on 3-Piece Journal Carriers
Thanks to this ABC analysis, you know that Watercolor Markers and 3-Piece Journal Carriers are class-A items, while Handheld Pencil Sharpeners are B items and the remaining items are C-level items. You can therefore use the ABC concept to sort your tasks for the day like so:
- Reorder Watercolor Markers
- Check stock levels on 3-Piece Journal Carriers
- Request a quote on Handheld Pencil Sharpeners
- Follow up with third-party logistics provider on transport of Holiday Glitter Jars
- Verify incoming shipment of Adhesive Crepe Paper Décor
If each task takes two hours, you may not be able to get to every item on the list. But your time is better used by prioritizing your tasks using this method, since you know the tasks you got to first were the ones that have the most impact on the company.
Best Inventory Management Software
The takeaway
ABC analysis seeks to classify your product catalog based on each item’s usage value—in other words, each item’s impact on your bottom line. Category A items are the most important since they make up the bulk of your company’s total inventory value. Category B and category C items are less important, but still affect your business’s profitability.
By classifying items in this way, you can effectively prioritize the items that have the greatest impact on your business. This helps make your employees more efficient and productive.
Inventory optimization techniques (like ABC analysis) are a lot easier when you use inventory management software. Check out our top inventory software picks to get started.
Disclaimer
At Business.org, our research is meant to offer general product and service recommendations. We don't guarantee that our suggestions will work best for each individual or business, so consider your unique needs when choosing products and services.
Recent Articles

The Best Inventory Apps of 2026
Choosing a good mobile inventory tracker makes it easier to manage your products on the...

Free Excel Inventory Management Template
If you’re looking for a cost-efficient solution to inventory management, Excel is an excellent choice....

Top 7 Free Inventory Management Systems for 2023
If an inventory management subscription just isn’t in the cards for your business, here are...

Fishbowl Inventory Review 2026
Fishbowl is designed for manufacturing and warehouse inventory management. It stands out with its QuickBooks...
